Operating Leverage Explained: Formula, Calculation & Why It Drives Profit Growth
By Rohini Rajpoot · 5 August 2026
Understand operating leverage, learn the operating leverage formula, calculate the Degree of Operating Leverage (DOL), and discover how fixed and variable costs impact profit growth, scalability, and
Two companies can post identical revenue growth this year and end up with wildly different profit growth. The reason usually comes down to operating leverage, which is the relationship between a company's cost structure and how much of each new sales dollar actually flows through to operating profit.
If you've ever wondered why a software company's profits can suddenly explode after years of modest growth, or why an airline can swing from record profits to steep losses within a single bad quarter, operating leverage is the concept behind both stories.
What Is Operating Leverage?
Operating leverage measures how sensitive a company's operating income is to changes in sales. It comes from the mix of fixed and variable costs in the business. A company with a lot of fixed costs relative to variable costs has high operating leverage, because once those fixed costs are covered, each additional sale contributes almost entirely to profit.
Put simply, operating leverage tells you how much operating income moves for a given move in revenue. A small increase in sales can produce a much larger jump in profit, and the reverse is also true. A small drop in sales can hit profit disproportionately hard.
This is why investors and business owners pay attention to it. A company's growth rate on paper doesn't tell you what happens to the bottom line when that growth speeds up or slows down. Operating leverage does.
Why Operating Leverage Matters
Operating leverage is one of the clearest signals of how scalable a business really is. Once a company covers its fixed costs, added revenue starts converting into profit at a much higher rate, which is why some businesses can grow profit faster than they grow sales.
It also affects cost efficiency in a direct way. A business with high fixed costs and strong sales volume spreads those costs over more units, lowering the average cost per unit as it scales.
EBIT (earnings before interest and taxes) is where the effect of operating leverage shows up first. Before a company's capital structure or tax situation enters the picture, operating leverage is already shaping how much operating profit comes out of a given level of sales.
For founders and investors, this matters when deciding how to structure a business, price a product, or evaluate a company's earnings risk. A business with high operating leverage rewards growth heavily, but it also punishes a downturn just as heavily, which changes how much risk is worth taking on.
Fixed Costs vs Variable Costs
Operating leverage comes down to one core question: how much of a company's cost base is fixed, and how much moves with sales volume?
Fixed costs stay roughly the same regardless of how much a company sells in a given period. Common examples include:
Rent on office or warehouse space
Employee salaries (as opposed to hourly or commission-based pay)
Equipment and depreciation
Software subscriptions and other recurring operating tools
Variable costs rise and fall with production or sales volume. Common examples include:
Raw materials
Shipping and logistics
Sales commissions
Direct production or manufacturing costs
A business with mostly fixed costs, like a software company that pays engineers a salary regardless of how many customers sign up, has high operating leverage. A business with mostly variable costs, like a consulting firm that pays contractors per project, has lower operating leverage. Its costs scale up and down with revenue, so profit grows more steadily but less dramatically.
Operating Leverage Formula
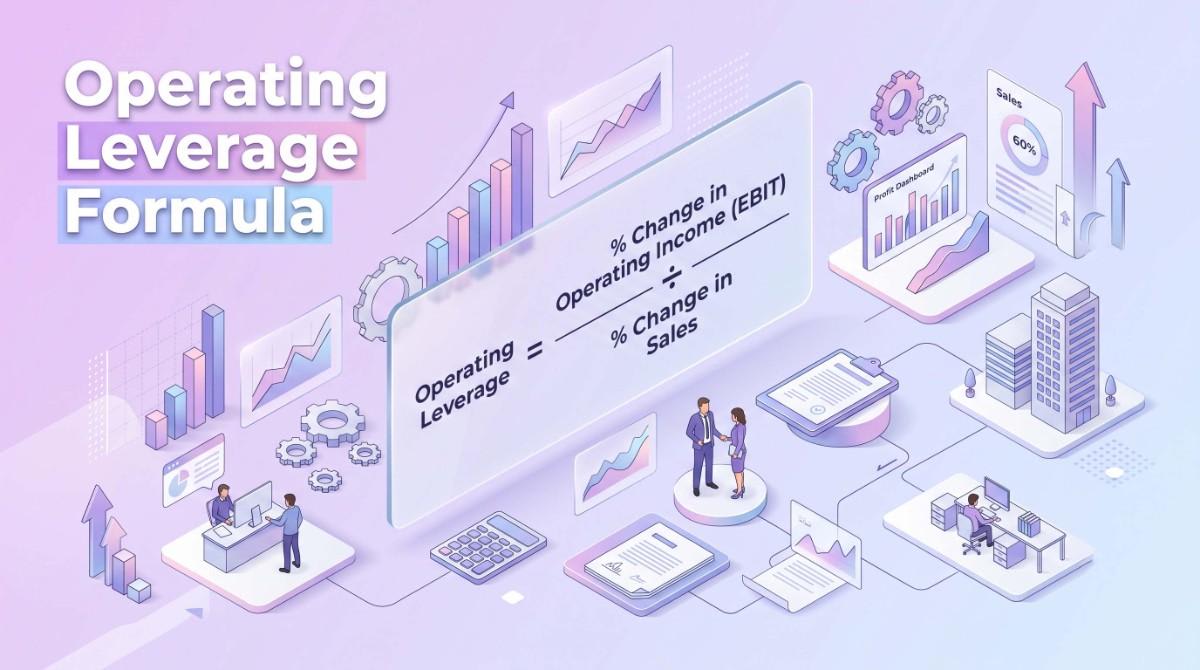 There are two common ways to express operating leverage.
Formula 1:
Operating Leverage = Contribution Margin ÷ Operating Income (EBIT)
Formula 2 (Degree of Operating Leverage):
DOL = % Change in EBIT ÷ % Change in Sales
Contribution Margin is revenue minus variable costs. It shows how much each sale contributes toward covering fixed costs and, once those are covered, toward profit.
Operating Income (EBIT) is what's left after both variable and fixed costs are subtracted from revenue.
Percentage change in sales captures how sales have moved between two periods, which the DOL formula compares against the resulting percentage change in EBIT.
Both formulas answer the same underlying question from slightly different angles: how much does profit move relative to sales?
How to Calculate Operating Leverage
Step 1: Calculate contribution margin: Subtract total variable costs from total revenue.
Step 2: Determine operating income (EBIT): Subtract fixed costs from the contribution margin.
Step 3: Apply the operating leverage formula: Divide contribution margin by operating income.
Step 4: Interpret the result: A higher number means a larger share of each incremental sale flows through to operating profit, which signals higher operating leverage and higher earnings sensitivity to sales changes.
Degree of Operating Leverage (DOL)
DOL is the more commonly used measure in financial analysis because it directly quantifies earnings sensitivity. It tells you, for every 1% change in sales, what percentage change to expect in operating income.
A DOL of 2.5, for example, means a 10% increase in sales should produce roughly a 25% increase in operating income, assuming the cost structure stays the same. The same relationship works in reverse during a downturn, which is exactly why investors use DOL to gauge risk, not just upside.
Analysts use DOL to model best-case and worst-case earnings scenarios, particularly for companies heading into a cyclical downturn or a period of rapid expansion. A high DOL business needs a smaller sales swing to produce a large swing in profit, in either direction.
Operating Leverage Calculation Example
Here's a simple example using a manufacturing business.
Revenue: ₹1,00,00,000 Variable Costs: ₹40,00,000 Fixed Costs: ₹35,00,000
Step 1: Contribution Margin ₹1,00,00,000 − ₹40,00,000 = ₹60,00,000
Step 2: Operating Income (EBIT) ₹60,00,000 − ₹35,00,000 = ₹25,00,000
Step 3: Operating Leverage ₹60,00,000 ÷ ₹25,00,000 = 2.4
Result: A DOL of 2.4 means that for every 1% change in sales, operating income is expected to change by roughly 2.4%. If sales rise by 10%, EBIT should rise by close to 24%, assuming the cost structure holds steady. If sales fall by 10% instead, EBIT would be expected to fall by a similar 24%, which is the tradeoff this business is exposed to given its current mix of fixed and variable costs.
High vs Low Operating Leverage
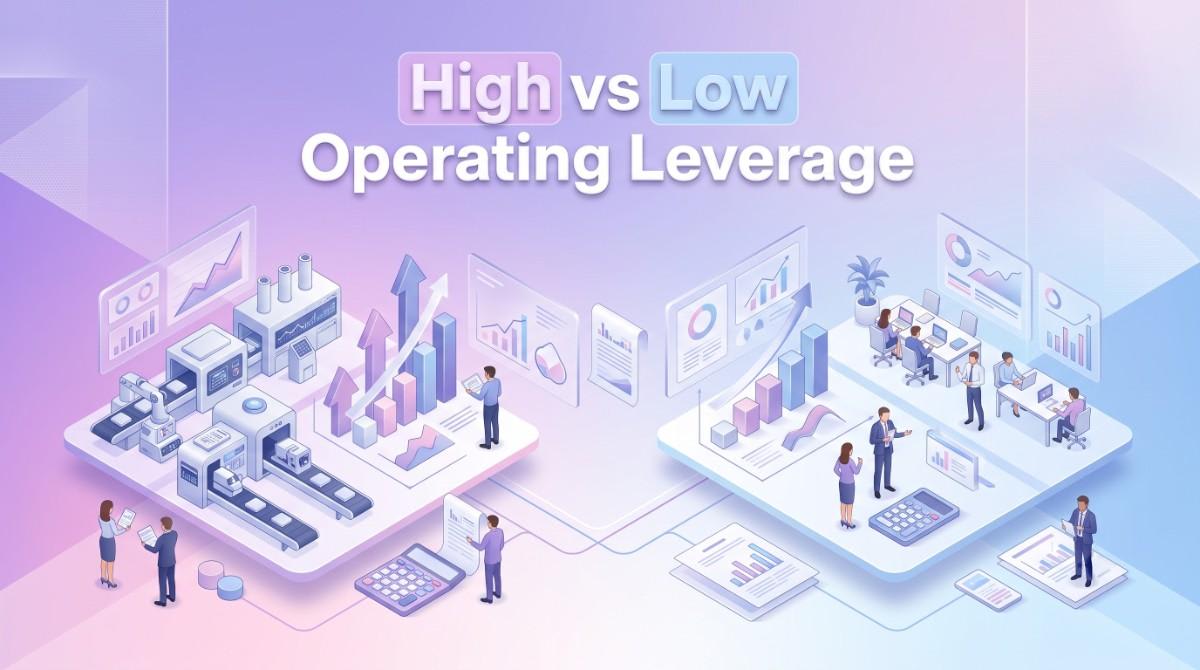
High Operating Leverage | Low Operating Leverage |
Higher fixed costs | Lower fixed costs |
Higher profit potential | More stable profits |
Greater earnings volatility | Lower business risk |
Highly scalable | Less scalable |
Businesses with high operating leverage, think software, media, or airlines, can generate outsized profit growth once they pass their break-even point. But that same structure works against them when sales slow down, since fixed costs don't shrink along with revenue.
Businesses with low operating leverage grow profit more slowly during good periods but hold up better during weak ones, because a larger share of their costs adjusts automatically with sales.
Operating Leverage vs Financial Leverage

These two types of leverage are often confused, but they measure different things.
Operating Leverage | Financial Leverage |
Driven by operating costs | Driven by debt financing |
Affects EBIT | Affects EPS and net income |
Related to business operations | Related to capital structure |
Operational risk | Financial risk |
Operating leverage comes from how a company runs its business, specifically the mix of fixed and variable costs. Financial leverage comes from how a company finances itself, specifically how much debt it carries relative to equity.
A company can have high operating leverage and low financial leverage, or the reverse, or both at once. When a business combines high operating leverage with high financial leverage, small changes in sales can produce very large swings in earnings per share, which is a combination worth watching closely as an investor.
Advantages of Operating Leverage
Operating leverage isn't inherently risky. Used well, it's a major source of competitive advantage.
Higher profit margins become possible once fixed costs are covered, since additional sales carry a much lower incremental cost. Businesses with strong operating leverage also tend to scale better, because growth doesn't require proportional increases in overhead.
Increased operating efficiency often follows naturally, as fixed costs get spread across a larger revenue base. And because profit can grow faster than sales, businesses with strong operating leverage often post stronger earnings growth than their revenue figures alone would suggest, which can translate into a real competitive advantage over rivals with a more variable cost structure.
Risks of High Operating Leverage
The same mechanics that make operating leverage attractive during growth periods make it dangerous during downturns.
A heavy fixed-cost burden doesn't shrink when sales fall, which means profit can decline much faster than revenue does. This creates earnings volatility that can catch investors and even management off guard if they've only modeled the upside case.
A sales downturn hits high-leverage businesses harder because there's less room to cut costs quickly. Break-even points also tend to sit higher for these businesses, meaning they need more revenue just to reach profitability in the first place.
During broader economic slowdowns, companies with high operating leverage are often the first to report sharp earnings misses, precisely because their cost structure amplifies whatever happens to sales, for better or worse.
How Businesses Improve Operating Leverage
Companies can shift their operating leverage profile over time, usually with deliberate strategy rather than by accident.
Automating operations reduces reliance on variable labor costs, shifting more of the cost base toward fixed costs like software or equipment, which increases leverage once volume grows.
Increasing sales volume without a proportional increase in fixed costs is the most direct path to higher leverage. This is why so many growth-stage companies focus heavily on scaling revenue against a mostly fixed cost base.
Improving contribution margin, whether through pricing, better supplier terms, or product mix changes, increases how much of each incremental sale flows to profit.
Optimizing the overall cost structure and reducing unnecessary fixed costs can also help, particularly for businesses trying to lower their break-even point without sacrificing much upside potential.
Industries with High Operating Leverage
Some industries are structurally built around high operating leverage.
SaaS and software companies carry high fixed costs (engineering, infrastructure) but very low variable costs per additional customer, which is why software businesses often show dramatic profit growth once they reach scale.
Airlines have enormous fixed costs (aircraft, crews, airport fees) that barely change whether a flight is half full or completely full, which is why airline profits and losses tend to swing so sharply with demand.
Manufacturing businesses often carry heavy fixed costs in plant and equipment, giving them meaningful operating leverage once factories run closer to capacity.
Telecommunications companies build expensive fixed infrastructure (towers, cables, networks) that supports a large and growing customer base at a relatively low incremental cost per user.
Media and streaming platforms produce content once and distribute it to a large audience at very low marginal cost, giving them some of the highest operating leverage profiles of any industry.
These industries share a common thread: heavy upfront investment in fixed infrastructure or product development, paired with the ability to serve a large volume of customers without a matching increase in cost.
Conclusion
Operating leverage measures how efficiently a business converts sales growth into operating profit, based on how much of its cost base is fixed versus variable. Businesses with strong operating leverage can scale profits rapidly once fixed costs are covered, which is part of why some companies compound earnings so much faster than their revenue growth alone would suggest.
Understanding operating leverage helps founders decide how to structure costs as they scale, helps investors judge how much earnings risk they're taking on, and helps managers make sharper decisions about pricing, hiring, and where to draw the line between fixed and variable spending.
Whether you're a startup or a growing business, Startup Coach can help you make smarter financial decisions, contact us today.
Frequently Asked Questions
1. What is operating leverage?
Operating leverage measures how sensitive a company's operating profit is to changes in sales, based on the mix of fixed and variable costs in its business.
2. How do you calculate operating leverage?
Divide contribution margin by operating income (EBIT), or use the Degree of Operating Leverage formula: percentage change in EBIT divided by percentage change in sales.
3. What is the Degree of Operating Leverage (DOL)?
DOL quantifies exactly how much operating income is expected to change for a given percentage change in sales, making it a key tool for modeling earnings sensitivity.
4. What is the difference between operating leverage and financial leverage?
Operating leverage comes from a company's cost structure and affects EBIT. Financial leverage comes from debt financing and affects EPS and net income.
5. Is high operating leverage good or bad?
Neither on its own. It amplifies both profit growth during good periods and losses during downturns, so whether it's good depends on the business's sales stability and growth trajectory.