Return on Incremental Invested Capital (ROIIC): The Formula Smart Investors Use to Spot Real Growth
By Rohini Rajpoot · 3 August 2026

Learn how to calculate Return on Incremental Invested Capital (ROIIC), understand the ROIIC formula, compare ROIIC vs ROIC.
Most investors look at revenue growth first. That's the easy number to find, and it feels like proof that a company is doing well. But revenue growth on its own doesn't tell you whether the company is actually creating value with the money it puts to work. That's where Return on Incremental Invested Capital, or ROIIC, comes in.
ROIIC measures how much profit a company generates from each new dollar it reinvests. If a business grows revenue by 20% but has to pour in huge amounts of fresh capital to get there, and the returns on that new capital are weak, the growth isn't worth much to shareholders. ROIIC catches that gap.
What Is Return on Incremental Invested Capital (ROIIC)?
ROIIC tells you how efficiently a company turns new invested capital into new profit. Instead of looking at total returns across everything the company has ever invested, it isolates the returns on the capital added during a specific period.
Think of it this way: a company that already has $500 million in invested capital and adds another $50 million this year isn't judged on the whole $550 million. ROIIC asks a narrower question. What did that extra $50 million actually produce?
This distinction matters because a company can have a solid overall return on capital while its newest investments are mediocre, or even destructive. A slowing ROIIC, even with steady headline growth, is often the first sign that a business is running out of good places to put its money.
Why ROIIC Matters More Than Revenue Growth
Revenue is easy to grow if you're willing to spend enough to grow it. Open more stores, hire more salespeople, acquire a competitor, cut prices to win market share. All of that can push the top line up while quietly wrecking the return on the capital behind it.
What actually builds long-term wealth for shareholders is capital that gets reinvested at high rates of return, year after year. Warren Buffett has made this point for decades: a dollar retained and reinvested is only worth more than a dollar in a shareholder's pocket if management can put it to work at an attractive rate. ROIIC is the number that tells you whether that's happening.
This is also why two companies with identical revenue growth rates can be worth very different amounts. If Company A earns 25% on every new dollar of capital and Company B earns 8%, Company A is compounding value at a much faster rate, even if their reported growth numbers look the same on a headline chart.
How to Calculate ROIIC
You need two financial statements to calculate ROIIC: the income statement (for NOPAT) and the balance sheet (for invested capital), across at least two comparable periods.
The formula:
ROIIC = Change in NOPAT ÷ Change in Invested Capital
Where:
NOPAT (Net Operating Profit After Tax) = Operating Income × (1 − Tax Rate)
Invested Capital = Total Debt + Total Equity − Cash and Cash Equivalents (or, alternatively, Fixed Assets + Net Working Capital)
You're comparing the change in NOPAT between two periods against the change in invested capital over that same stretch. Picking the right time period matters a lot here. A single year can be noisy because of one-off spending or timing quirks in when capital gets deployed versus when it starts paying off. Many analysts look at rolling 3 to 5 year periods to smooth this out.
ROIIC Formula Explained
Breaking the formula down piece by piece helps clarify what's actually being measured.
NOPAT strips out the effect of financing decisions (interest expense) and shows how profitable the core operations are, after taxes. It's a cleaner measure than net income because two companies with identical operating performance but different debt loads will still show comparable NOPAT.
Incremental invested capital is simply this period's invested capital minus last period's. It captures everything the company has added, whether through retained earnings, new debt, new equity, or a combination.
Reinvestment refers to how the company chooses to deploy that new capital, whether into new factories, R&D, acquisitions, working capital, or something else. The reinvestment decision is what ROIIC is ultimately grading.
Capital allocation is the broader skill this metric is trying to assess. A management team with strong capital allocation puts money into projects that earn well above the company's cost of capital, and returns money to shareholders (via dividends or buybacks) when it can't find opportunities that clear that bar.
Component | What It Measures |
NOPAT | After-tax operating profit, ignoring financing structure |
Invested Capital | Debt + Equity − Cash |
Change in NOPAT | Growth in profit over the period |
Change in Invested Capital | New capital deployed over the period |
ROIIC | Profit generated per dollar of new capital |
Step-by-Step ROIIC Calculation Example
Here's a simple example using a fictional company, Northbridge Manufacturing.
Year 1
Invested Capital: $10,000,000
NOPAT: $2,000,000
Year 2
Invested Capital: $12,000,000
NOPAT: $2,800,000
Calculation:
Change in NOPAT = $2,800,000 − $2,000,000 = $800,000 Change in Invested Capital = $12,000,000 − $10,000,000 = $2,000,000
ROIIC = $800,000 ÷ $2,000,000 = 40%
Interpretation: Northbridge added $2 million in new capital during the year and generated an incremental after-tax return of 40% on that capital. If Northbridge's cost of capital is somewhere around 9-10%, this is an excellent outcome. It means the extra $2 million is doing far more work than an average investment would, and management appears to know where to put fresh money to good use.
Compare that to a company where invested capital grew by $2 million but NOPAT only rose by $100,000. That's a 5% ROIIC, likely below the cost of capital, which would be a warning sign even if total revenue was climbing at the same time.
ROIIC vs ROIC: What's the Difference?
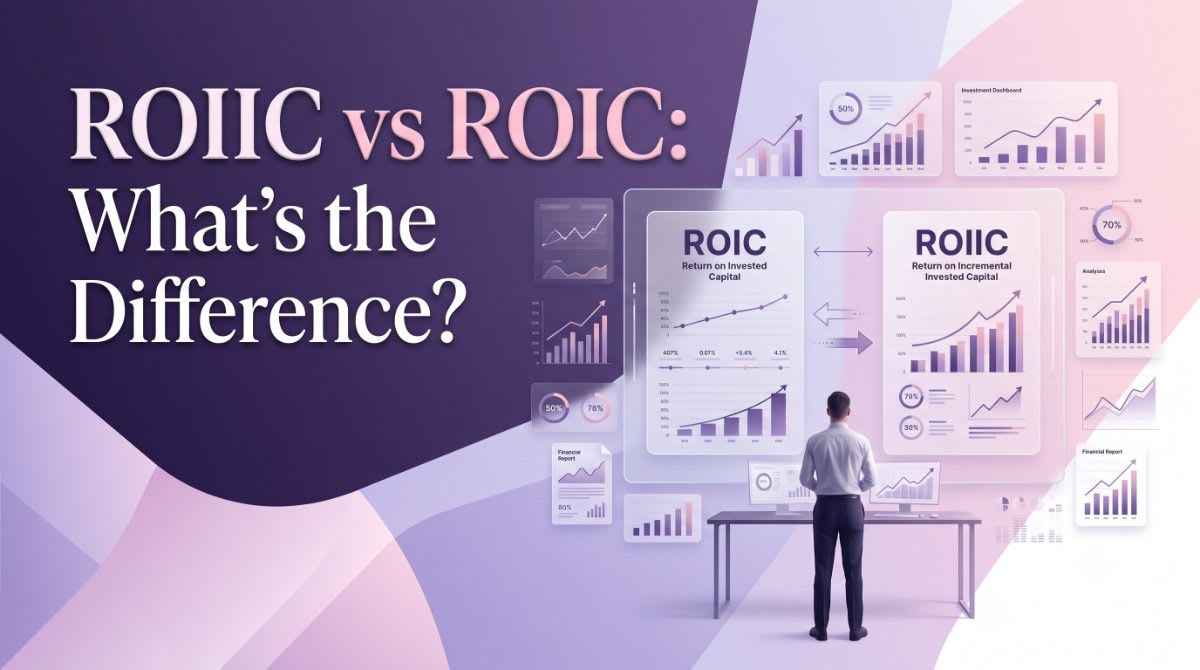 These two metrics are related but answer different questions, and investors often mix them up.
ROIIC | ROIC |
Measures returns on new capital | Measures return on all capital |
Forward-looking | Historical/cumulative |
Better for evaluating growth companies | Better for evaluating mature businesses |
Shows capital allocation quality | Shows overall efficiency |
ROIC (Return on Invested Capital) looks at total NOPAT against total invested capital, giving you a snapshot of how the whole business is performing right now, based on everything it has built up over the years. ROIIC narrows the focus to what's happening at the margin, with the newest capital.
A mature company can have a high ROIC built from decades of good decisions, even if its most recent investments are producing weaker returns. That's exactly the kind of thing ROIIC will flag before it shows up in the overall ROIC number. When analyzing businesses, most experienced investors use both metrics together rather than picking one over the other.
Why Smart Investors Use ROIIC
ROIIC has become a favorite metric among value-oriented and quality-focused investors for a few practical reasons.
It exposes capital allocation skill more directly than almost any other single number. A management team that consistently reinvests at high ROIIC is compounding shareholder wealth at a rate that revenue growth or EPS growth alone won't show you, since both of those can be inflated through debt, buybacks, or one-time items.
It's also a better early warning system than most alternatives. A company's overall ROIC can stay respectable for years even as the returns on new investments quietly deteriorate, because the older, high-return capital is still propping up the average. ROIIC catches that deterioration much earlier, which matters if you're trying to avoid holding a stock through a slow decline.
What Is a Good ROIIC?
There's no single number that applies across every industry, but as a general guide:
Below 10%: Often a red flag, especially if the company's cost of capital is in a similar range. New investments may not be creating value.
10-15%: Reasonable, though not exceptional. Worth checking whether this is comfortably above the company's cost of capital.
15-20%: Strong. Suggests management is finding genuinely good opportunities for new capital.
Above 20%: Excellent, and worth investigating why. Sometimes this reflects a real competitive advantage; other times it's the result of a small base of incremental capital that won't hold up as the company scales.
Always compare ROIIC against the company's weighted average cost of capital (WACC). A 12% ROIIC sounds fine in isolation, but if the company's cost of capital is 11%, the margin of value creation is razor thin.
Common Mistakes While Calculating ROIIC
A few errors show up often enough that they're worth calling out directly.
Using the wrong time period. A single-year snapshot can be distorted by lumpy capital spending, a big acquisition, or a delayed payoff on an earlier investment. Look at multi-year averages when possible.
Ignoring acquisitions. If a company grew its invested capital mainly through a large acquisition, the resulting ROIIC may say more about the deal price than about organic capital allocation skill.
Using net income instead of NOPAT. Net income includes interest expense and other financing effects, which muddies the comparison, especially for companies with different debt levels.
Ignoring capital expenditures buried in working capital. Some of the capital a company deploys shows up as inventory or receivables growth rather than obvious capex. Missing this understates the true invested capital change.
Misreading the balance sheet. Cash balances, minority interests, and off-balance-sheet items can all throw off the invested capital figure if they're not handled consistently between periods.
Limitations of ROIIC
ROIIC is useful, but it isn't a metric you should rely on in isolation.
It doesn't work well for banks and other financial institutions, where "invested capital" doesn't mean the same thing as it does for an industrial or consumer business. Capital-intensive industries like utilities, telecom, or heavy manufacturing often show naturally lower ROIIC simply because of how the business is structured, not because management is doing a poor job.
One-time gains, whether from asset sales or legal settlements, can distort NOPAT for a period and make ROIIC look artificially high or low. Accounting adjustments, including changes in depreciation policy or how leases are treated, can shift invested capital figures in ways that have nothing to do with real reinvestment decisions.
Young startups present their own challenge. With limited operating history and often negative NOPAT in early years, ROIIC can be volatile or meaningless until the business matures into consistent profitability.
ROIIC and Capital Allocation Efficiency
ROIIC connects directly to a company's reinvestment rate, which is the portion of profit a company puts back into the business rather than distributing to shareholders.
A high reinvestment rate paired with a high ROIIC is the combination that drives real compounding. A company reinvesting 60% of its earnings at a 20% ROIIC is building intrinsic value faster than one reinvesting the same 60% at a 6% ROIIC, even if both companies report identical growth in book value from year to year.
This is where sustainable growth theory becomes relevant. A company's sustainable growth rate is roughly its reinvestment rate multiplied by its return on incremental capital. Push either number higher without hurting the other, and you get faster compounding. Push reinvestment higher while ROIIC falls, and you're often just growing the business without growing its value proportionally.
ROIIC, Free Cash Flow, and Compounding Returns
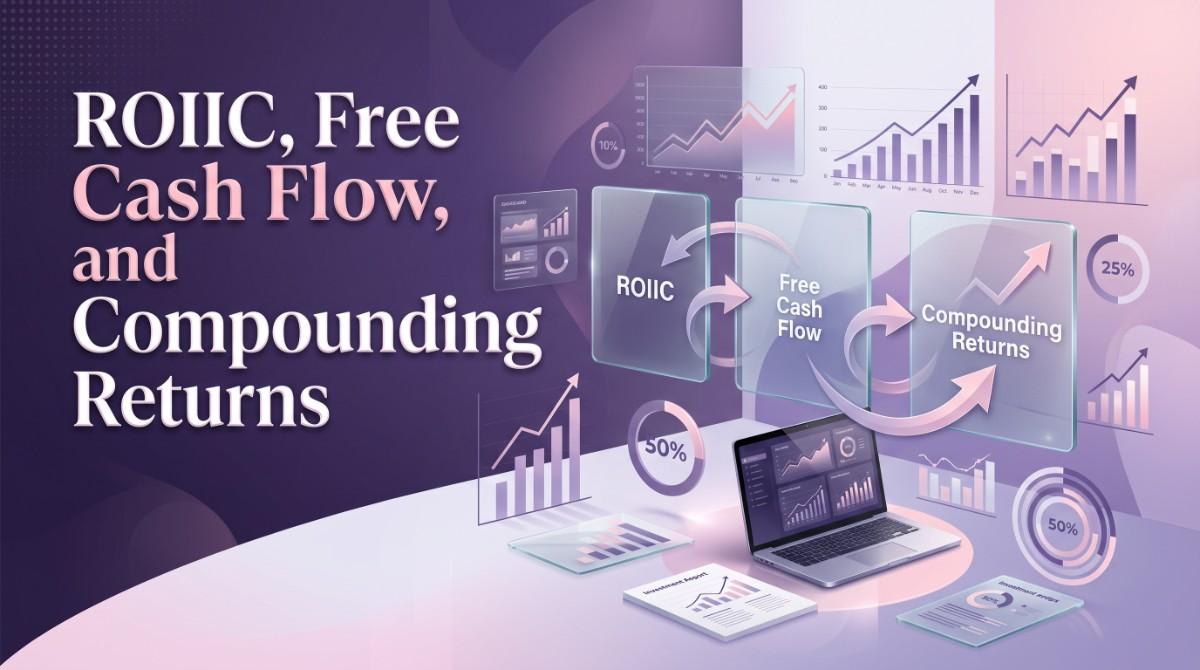
Free cash flow growth backed by a strong ROIIC tends to be higher quality than free cash flow growth achieved through cost cutting or working capital squeezes, since the former reflects genuine reinvestment success rather than one-time efficiency gains.
Owner earnings, a concept Buffett has written about, is closely tied to this idea. It adjusts reported earnings for the capital a business actually needs to maintain and grow its operations. A company with high ROIIC needs comparatively less capital to generate each incremental dollar of owner earnings, which is a meaningful advantage over time.
This is ultimately what long-term wealth creation comes down to: a business that can take retained profit, reinvest it at attractive rates, and repeat that process for years or decades. ROIIC is one of the clearest windows into whether that engine is actually working.
How Startup Founders Can Use ROIIC
ROIIC isn't only a tool for public market investors. Founders can use the same underlying logic to make better decisions about where to put new funding.
When evaluating an expansion into a new market or product line, look at the incremental profit that expansion is expected to generate relative to the capital it requires. This forces a more disciplined comparison than looking at projected revenue alone.
When deciding between competing internal projects, whichever one is likely to produce the higher return on the capital it needs is usually the better claim on limited resources, all else being equal.
Tracking ROIIC over time also helps founders see whether the business is actually becoming more profitable to scale, or whether each new dollar of growth is getting more expensive to produce. That second pattern often shows up before it becomes obvious in the topline numbers, giving founders a chance to course correct earlier.
Investors evaluating a startup for follow-on funding will often ask, implicitly or explicitly, some version of this question: what did the last round of capital actually produce? Founders who can answer that clearly, with real numbers, tend to raise on better terms.
Conclusion
ROIIC measures how effectively a company turns new capital into new profit, which makes it one of the more honest tests of whether growth is actually building value or just adding size. A business with high ROIIC and a healthy reinvestment rate compounds shareholder wealth in a way that revenue growth alone can't guarantee.
No single metric tells the whole story, though. Pair ROIIC with ROIC, free cash flow trends, and the company's reinvestment rate, and you get a much clearer picture of whether a business, or a startup's own reinvestment decisions, are genuinely creating value over time.
Want expert guidance on evaluating investments or improving your capital allocation strategy? Contact our team today.
Frequently Asked Questions
1. What is ROIIC?
ROIIC (Return on Incremental Invested Capital) measures the profit a company generates from the new capital it invests during a specific period, rather than from all the capital it has ever invested.
2. How do you calculate ROIIC?
Divide the change in NOPAT between two periods by the change in invested capital over that same period. ROIIC = ΔNOPAT ÷ ΔInvested Capital.
3. What is the difference between ROIIC and ROIC?
ROIC measures returns on total invested capital and reflects a company's overall historical efficiency. ROIIC measures returns only on new capital added during a specific period, making it more forward-looking.
4. What is considered a good ROIIC?
Generally, anything above 15% is considered strong, though this depends heavily on the industry and should always be compared against the company's cost of capital.
5. Why is ROIIC important for investors?
It reveals whether a company's most recent capital allocation decisions are creating value, often before that shows up in overall return metrics or headline growth numbers.
6. Can startups use ROIIC?
Yes, though it's harder to apply meaningfully until a startup has a consistent operating history and positive NOPAT. Founders can still use the underlying logic to evaluate individual investment decisions.
7. Is ROIIC better than ROIC? Neither is strictly better.
They answer different questions. ROIIC is more useful for spotting emerging trends in capital allocation, while ROIC gives a fuller picture of overall business quality.